OneHQ | Report Builder Case Study
Compose client-ready reports from live data with versioning, branding, and scheduled delivery
Build once. Stay consistent.
Role
Product Designer (IC)
Product Designer (IC)
Time
8 months
8 months
Platform
Web App
Web App
Team
2 Engineers, PD (me)
2 Engineers, PD (me)
Constraints
Maintain layout familiarity, reuse existing reporting pipeline and chart components, handle large books of business, respect carrier naming and locked compliance copy, use existing permissions and audit logging, secure expiring links only.
Maintain layout familiarity, reuse existing reporting pipeline and chart components, handle large books of business, respect carrier naming and locked compliance copy, use existing permissions and audit logging, secure expiring links only.
Scope
End-to-end product design (discovery -> delivery)
End-to-end product design (discovery -> delivery)

TL;DR
Compose, version, and send multi-page reports without leaving OneHQ.
Freeze numbers to an as-of date and keep a clear version history.
Schedule delivery as PDF or secure link with consistent branding.
The Problem
Monthly and quarterly updates relied on exports and copy-paste into slides.
Naming drift from carrier labels caused mismatches and rework.
Form-like layout made the final output hard to predict.
Teams lost track of which version was sent and when.
Goals
One place to compose, preview, and send.
Versioning with visible as-of date.
Faster assembly with fewer errors.
Reusable templates and smart defaults.
Solution at a Glance
1) Canvas with Sections and Blocks
The canvas mirrors the final report. Add sections (Overview, Premiums, Claims, Renewals, Notes) and drop blocks (charts, tables, KPIs, text, dividers).
Design notes: left sidebar for structure, right panel for block settings, sensible defaults.
2) As-of Date and Versioning
Freeze numbers to a specific date. Each freeze creates a version you can preview and reuse.
Design notes: as-of shown in header and footer, simple revert.
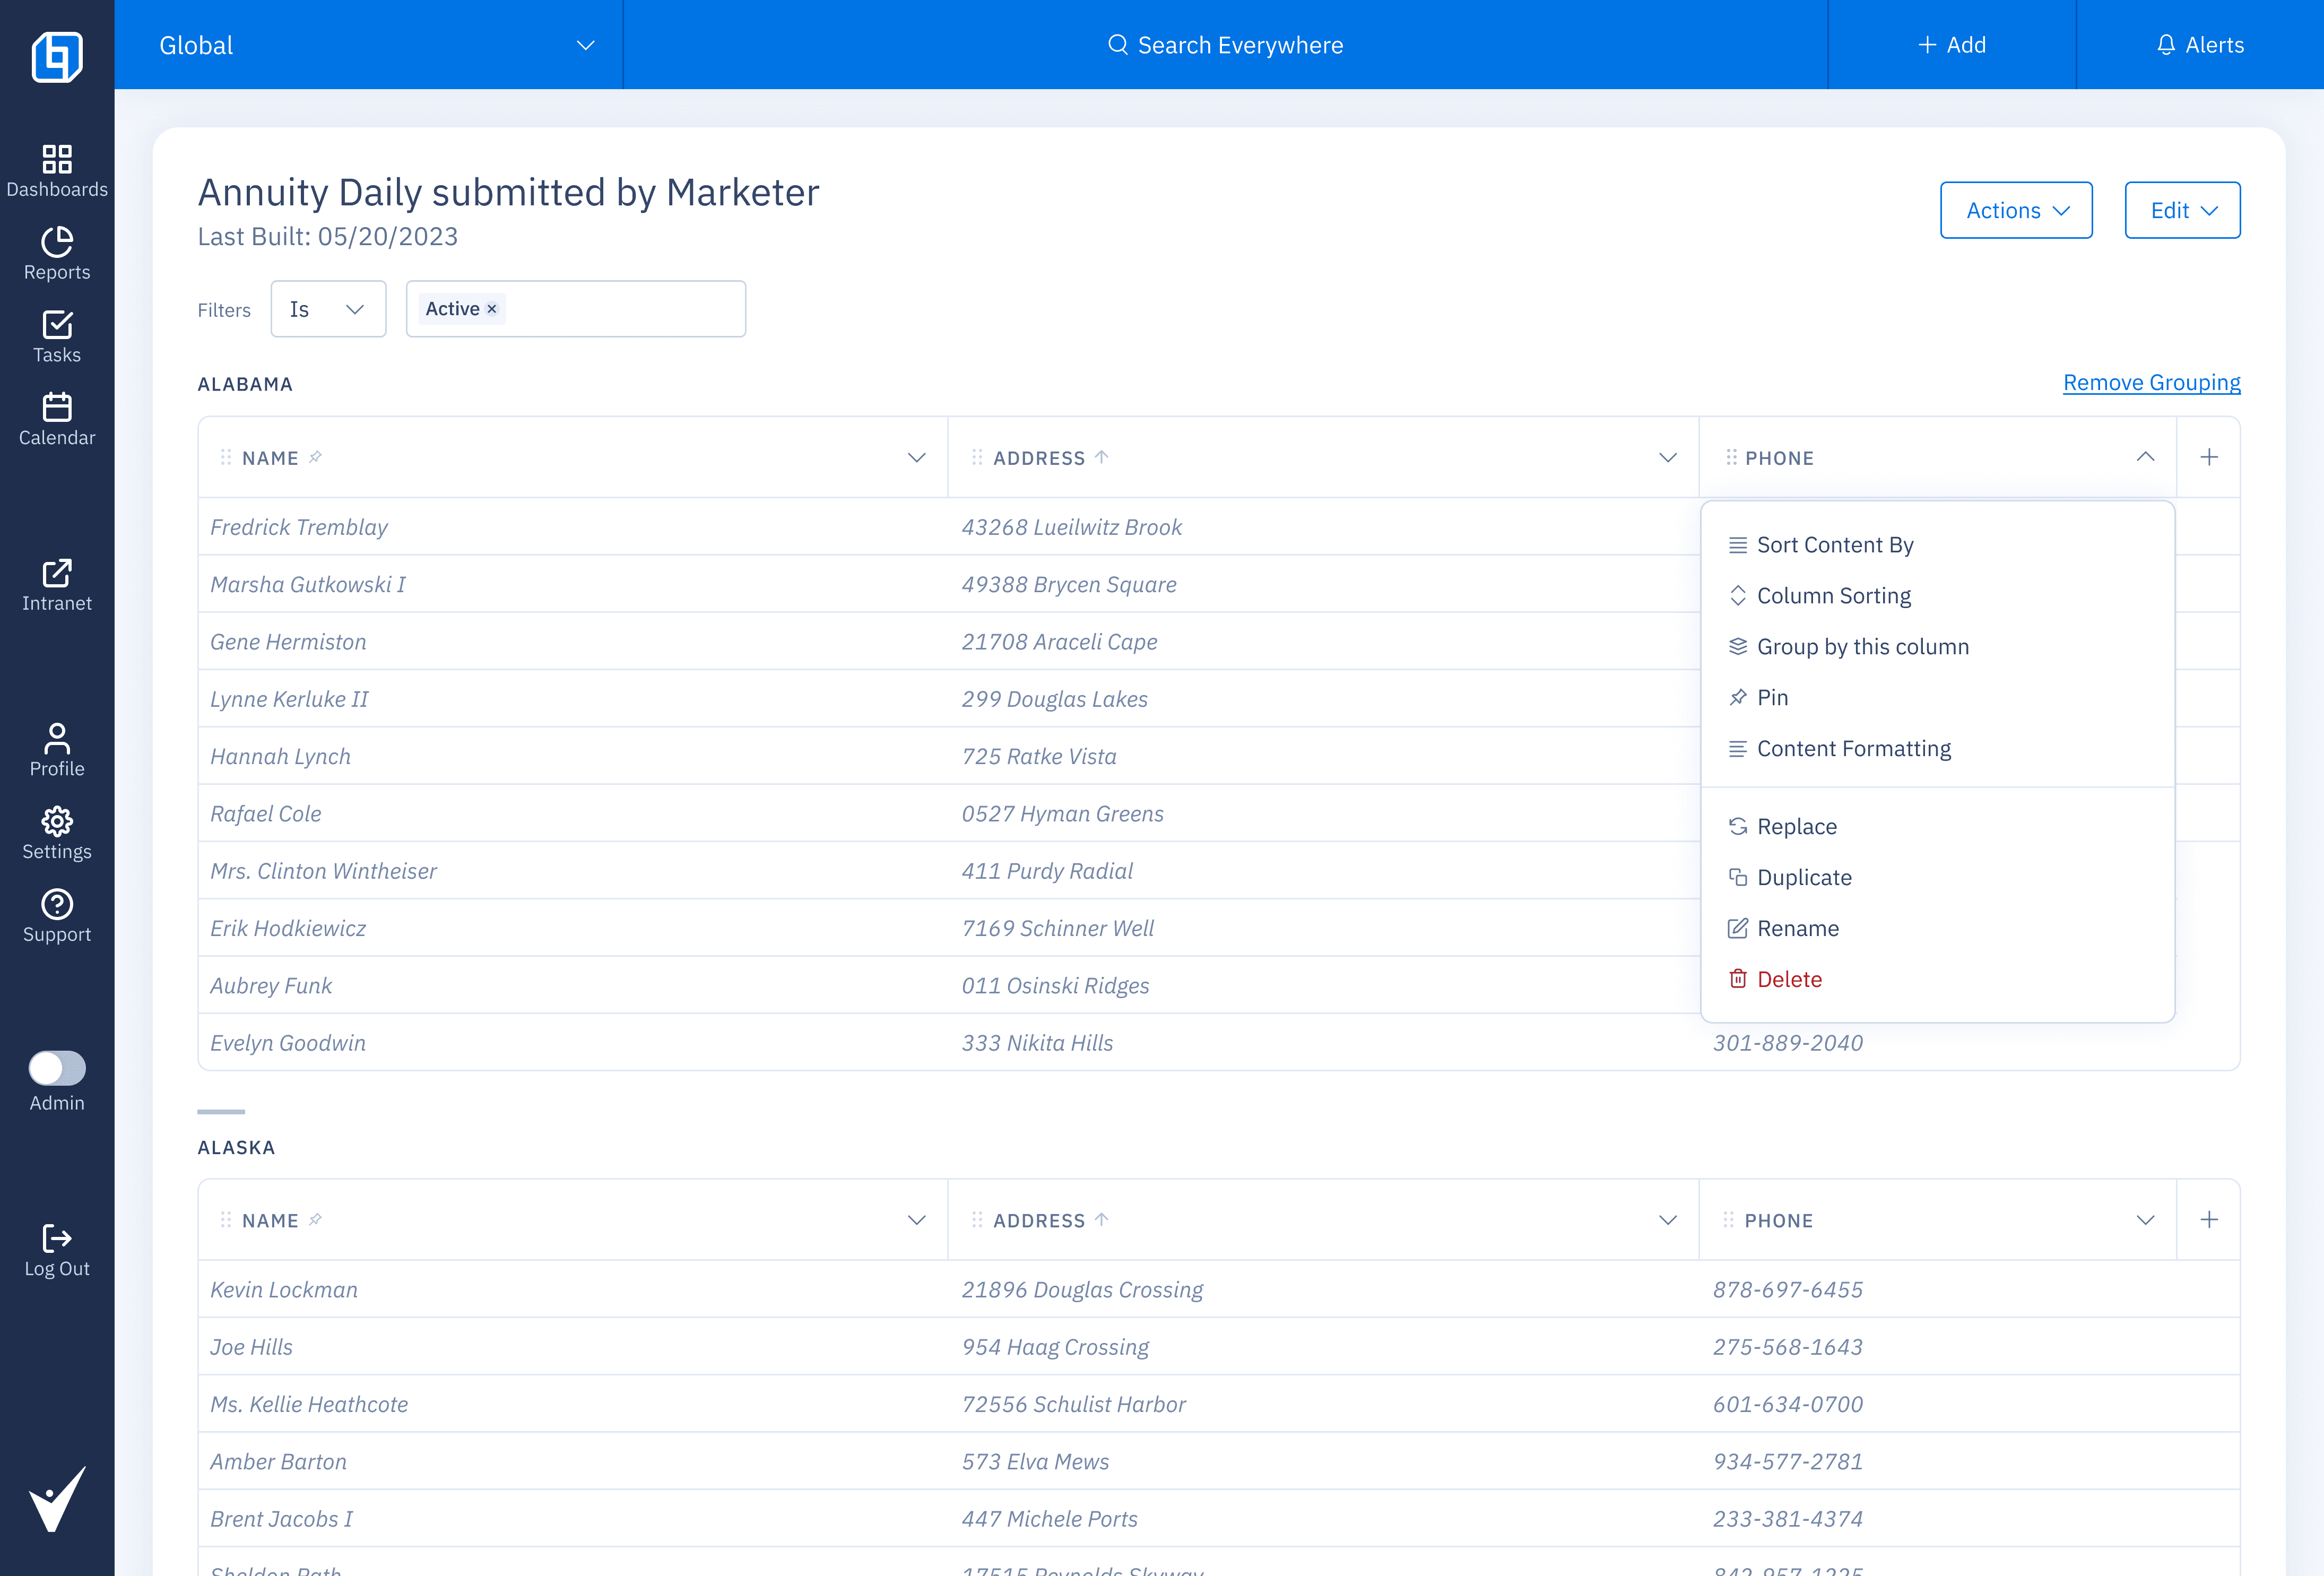
3) Publishing History
A thumbnail timeline lists every version with date and sender. Open any version to see exactly what went out.
Design notes: compact previews, clear sender identity, guardrail before resending older versions.
4) Scheduling controls
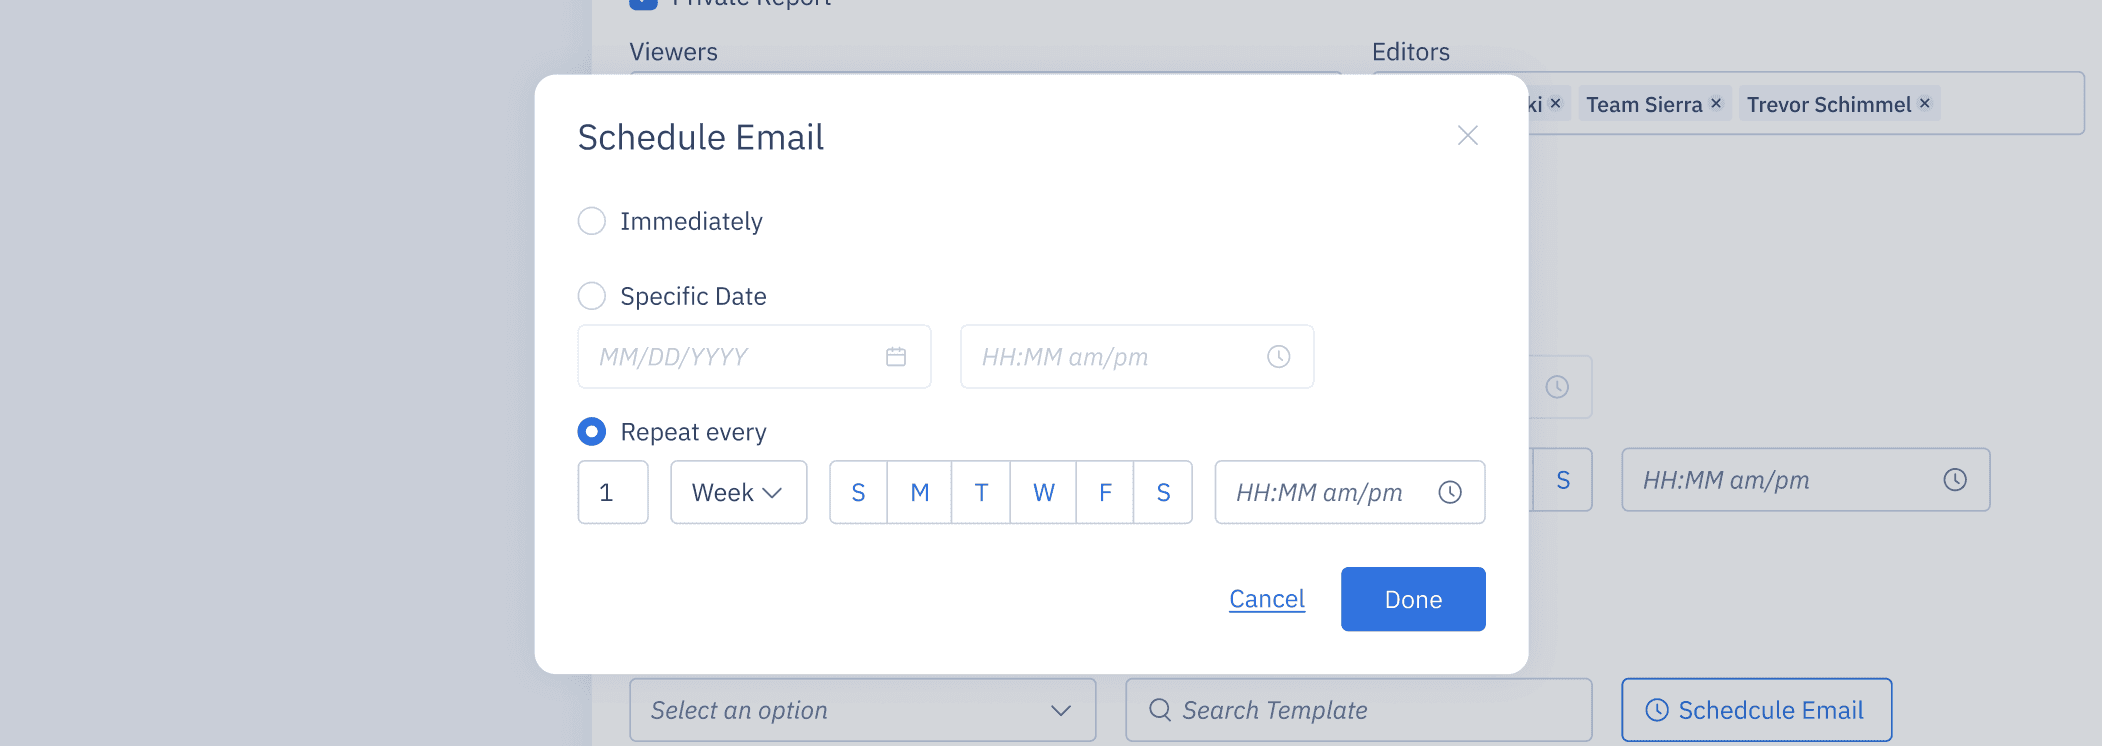
Immediate, specific date, or repeat every N weeks on selected weekdays at a set time. Works across time zones, respects permissions, and uses expiring links by default.
Design notes: weekday chips for quick selection, natural-language summary of the schedule, preview of the next send time, guardrails for past dates, one-click pause, clear Done state.
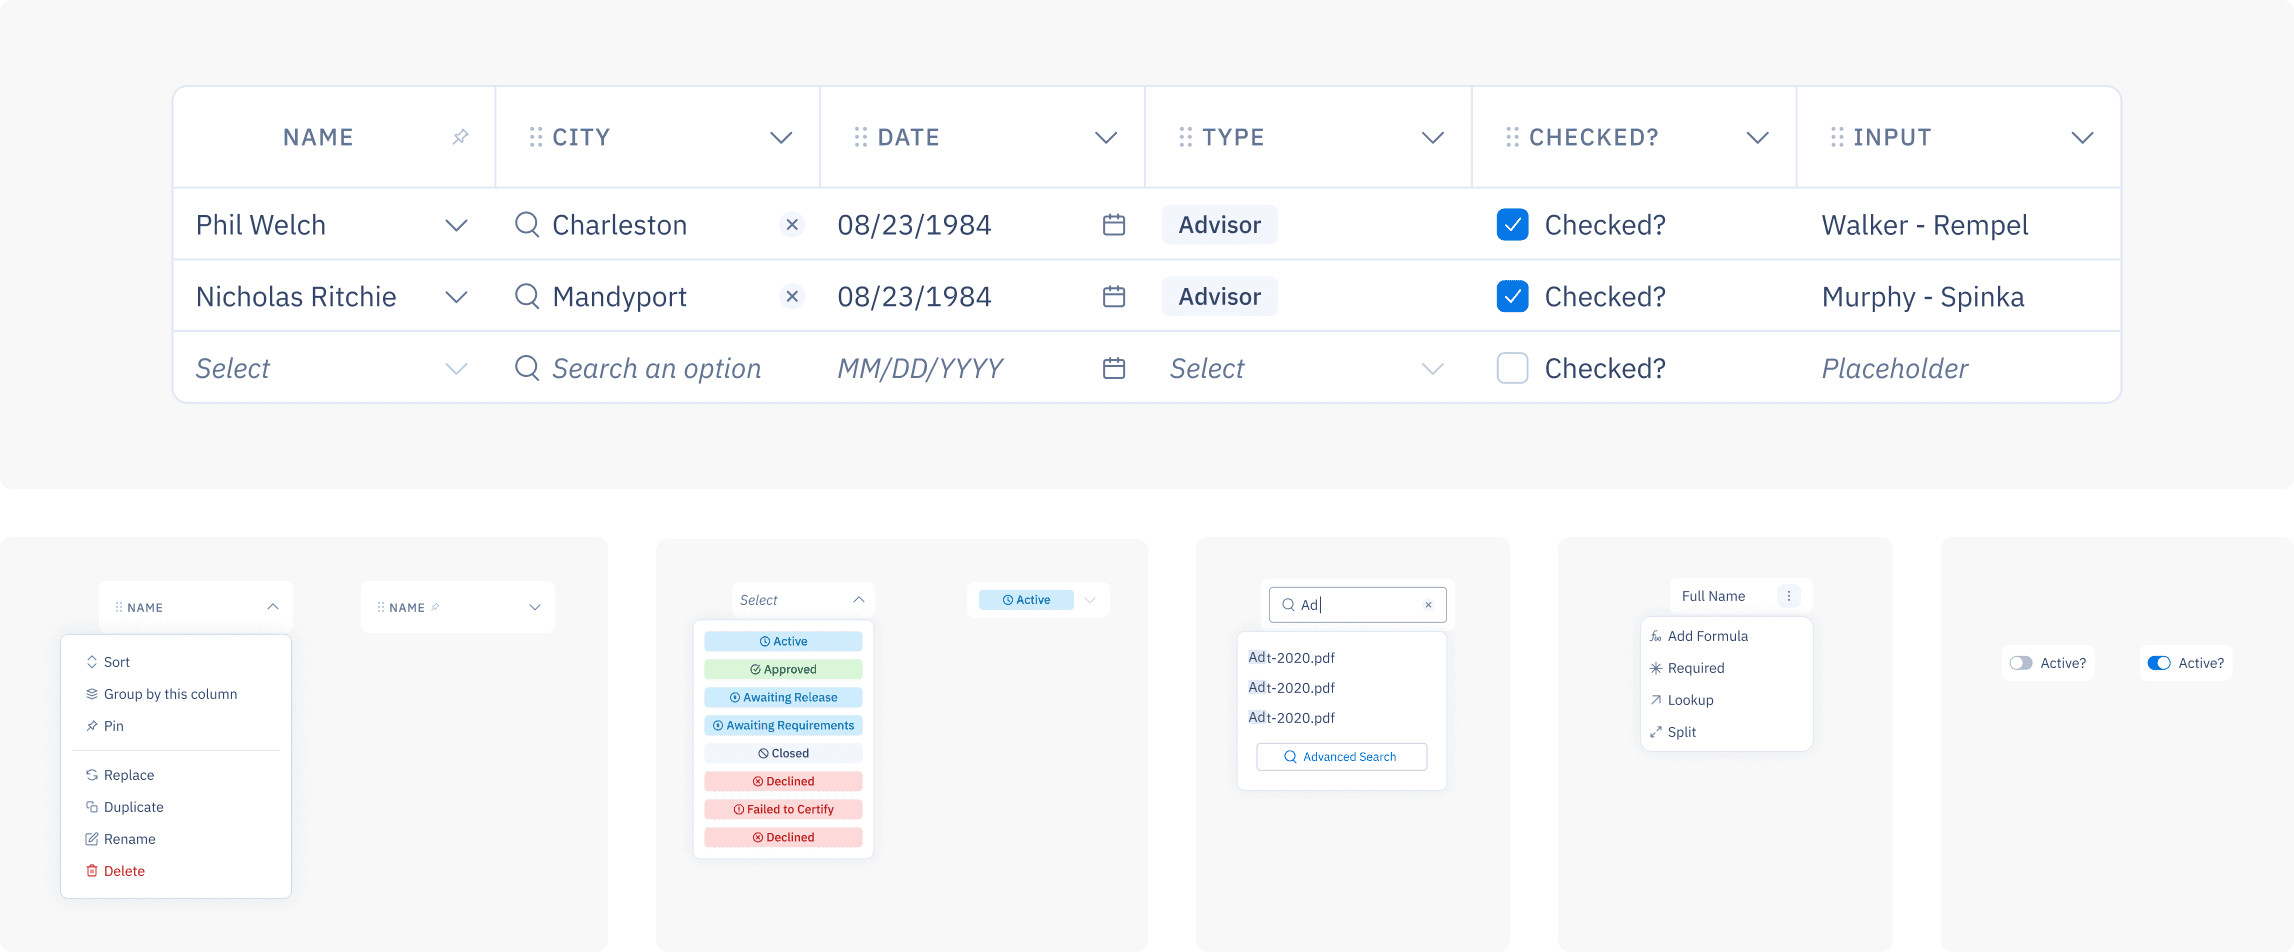
5) Output settings (visualization cards)
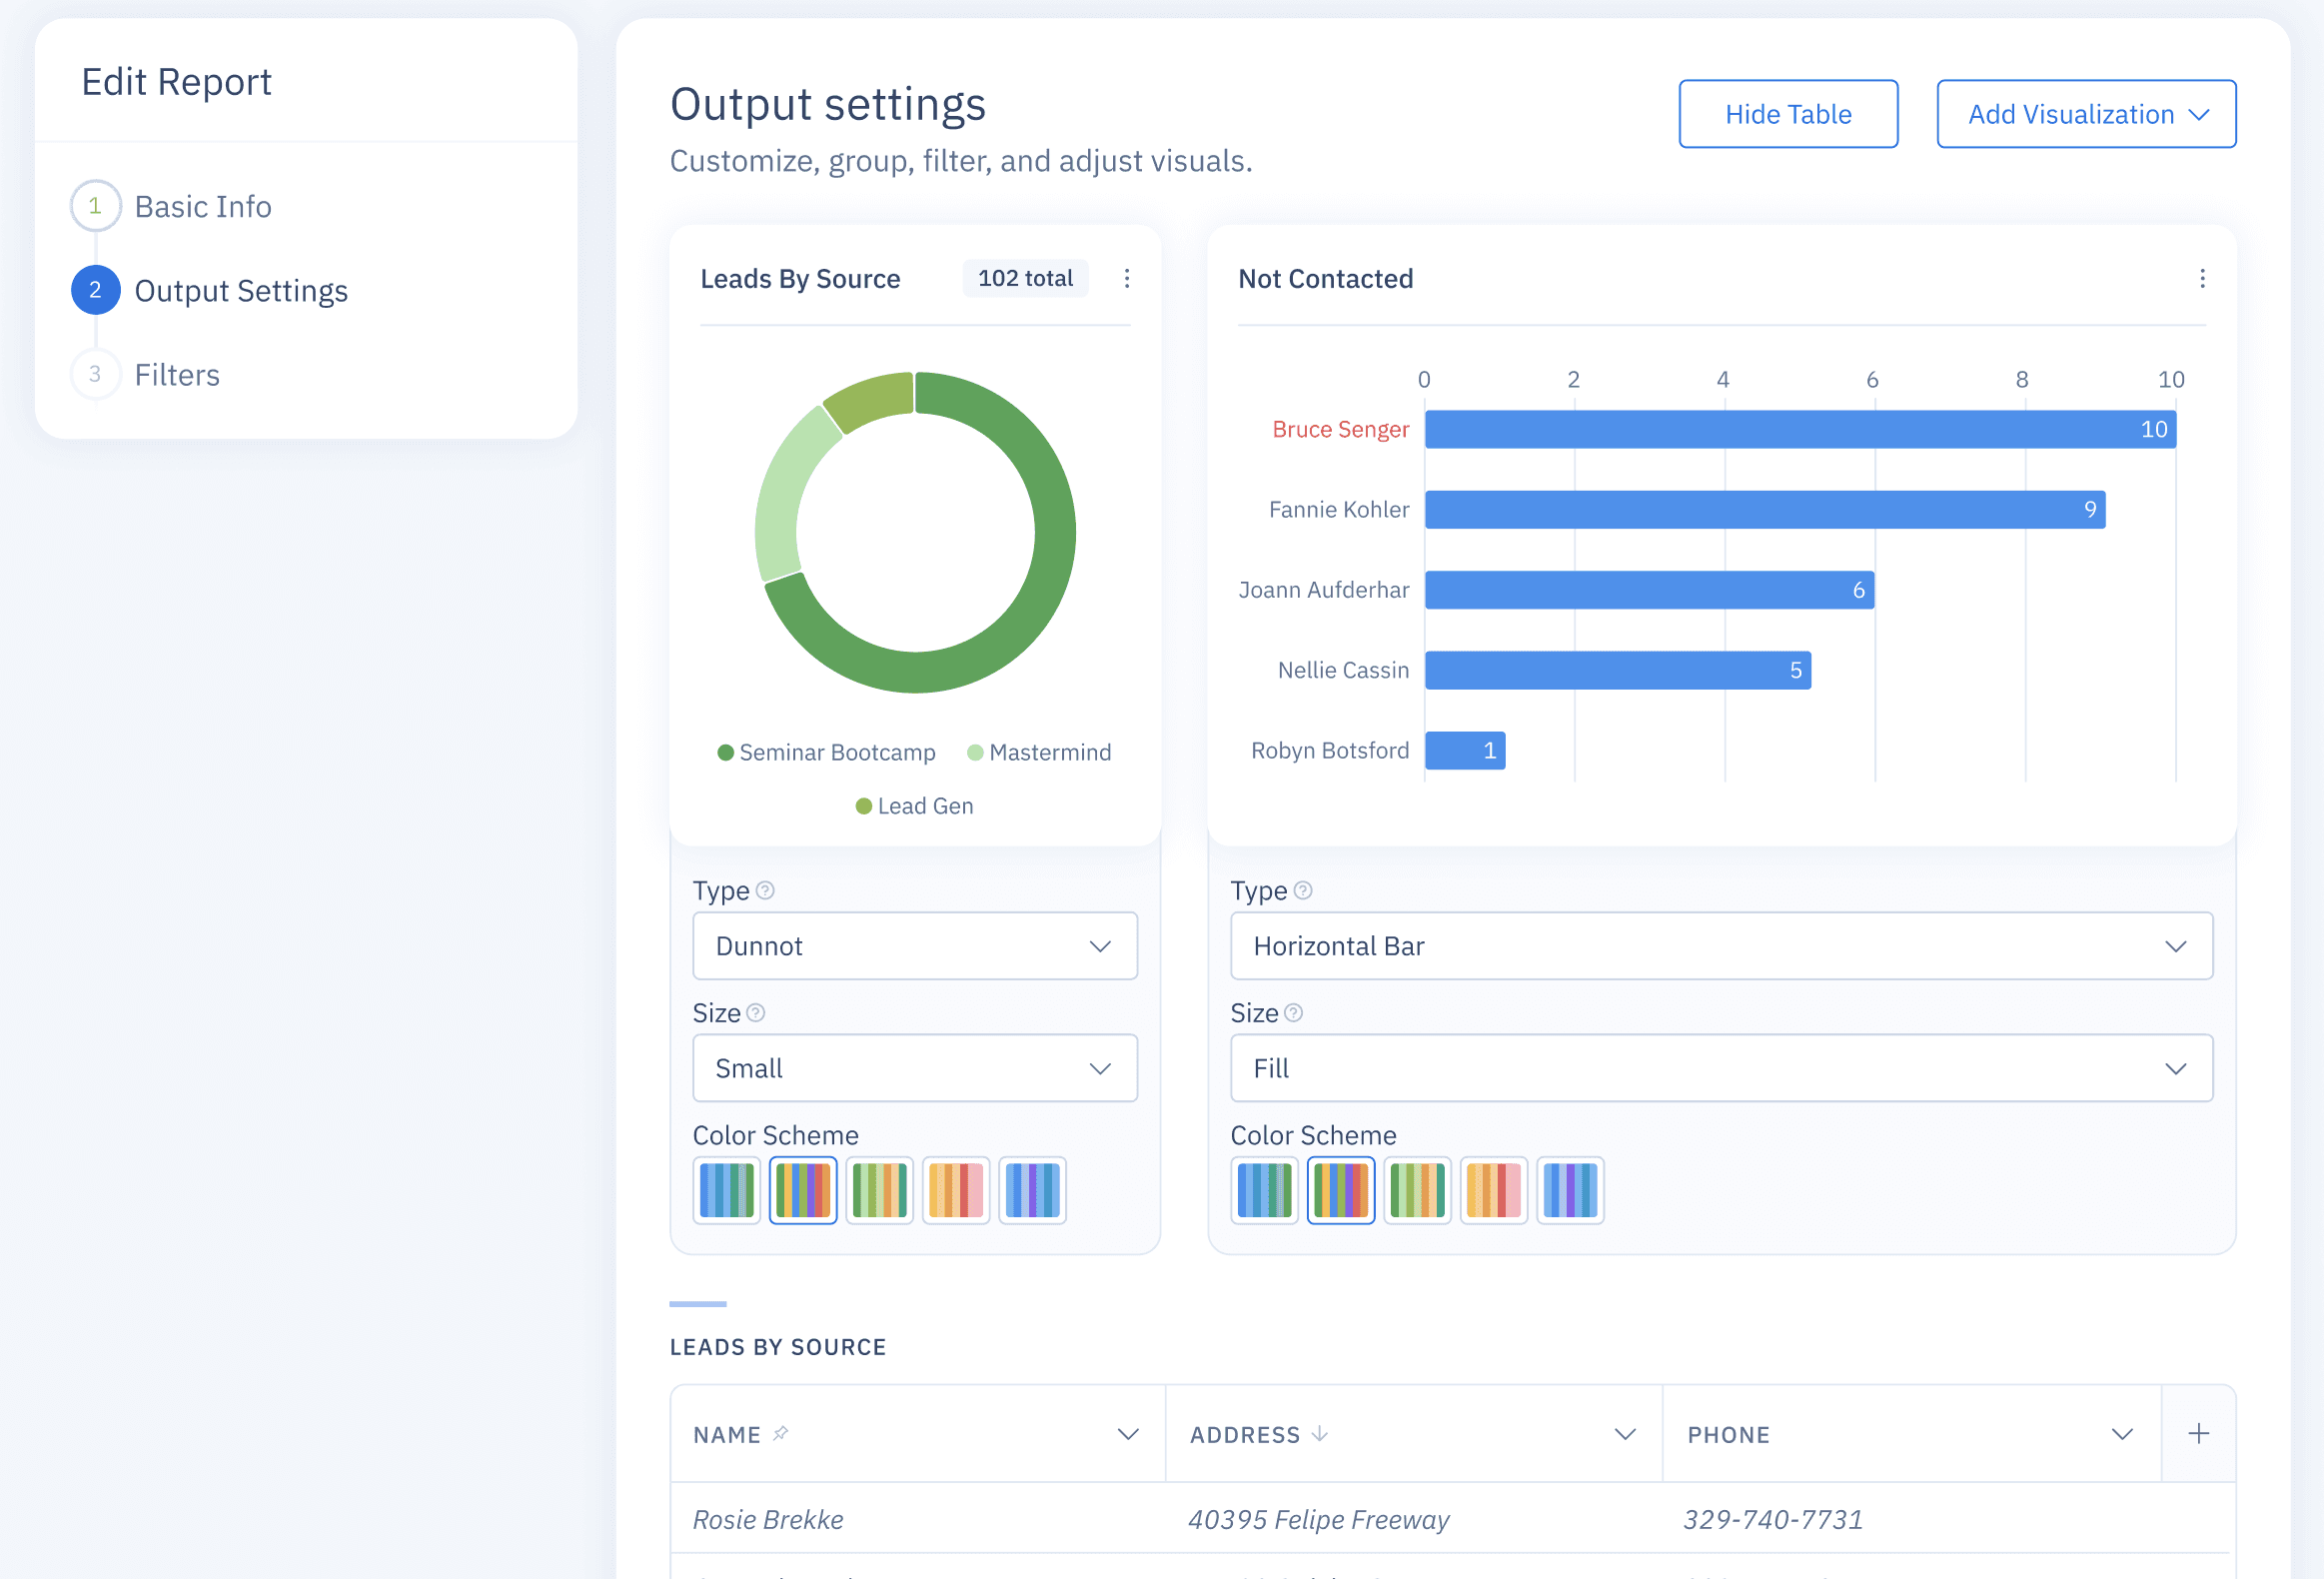
Make charts editable in-place: change type, size, color scheme, and grouping without leaving context. Add or remove visualizations with one click.
Design notes: live preview in each card, friendly dropdowns for Type, Size, and Color Scheme, accessible palettes, guardrails for invalid combinations, Hide Table to reduce noise, Add Visualization anchored in the header, keyboard and screen reader labels on all controls.
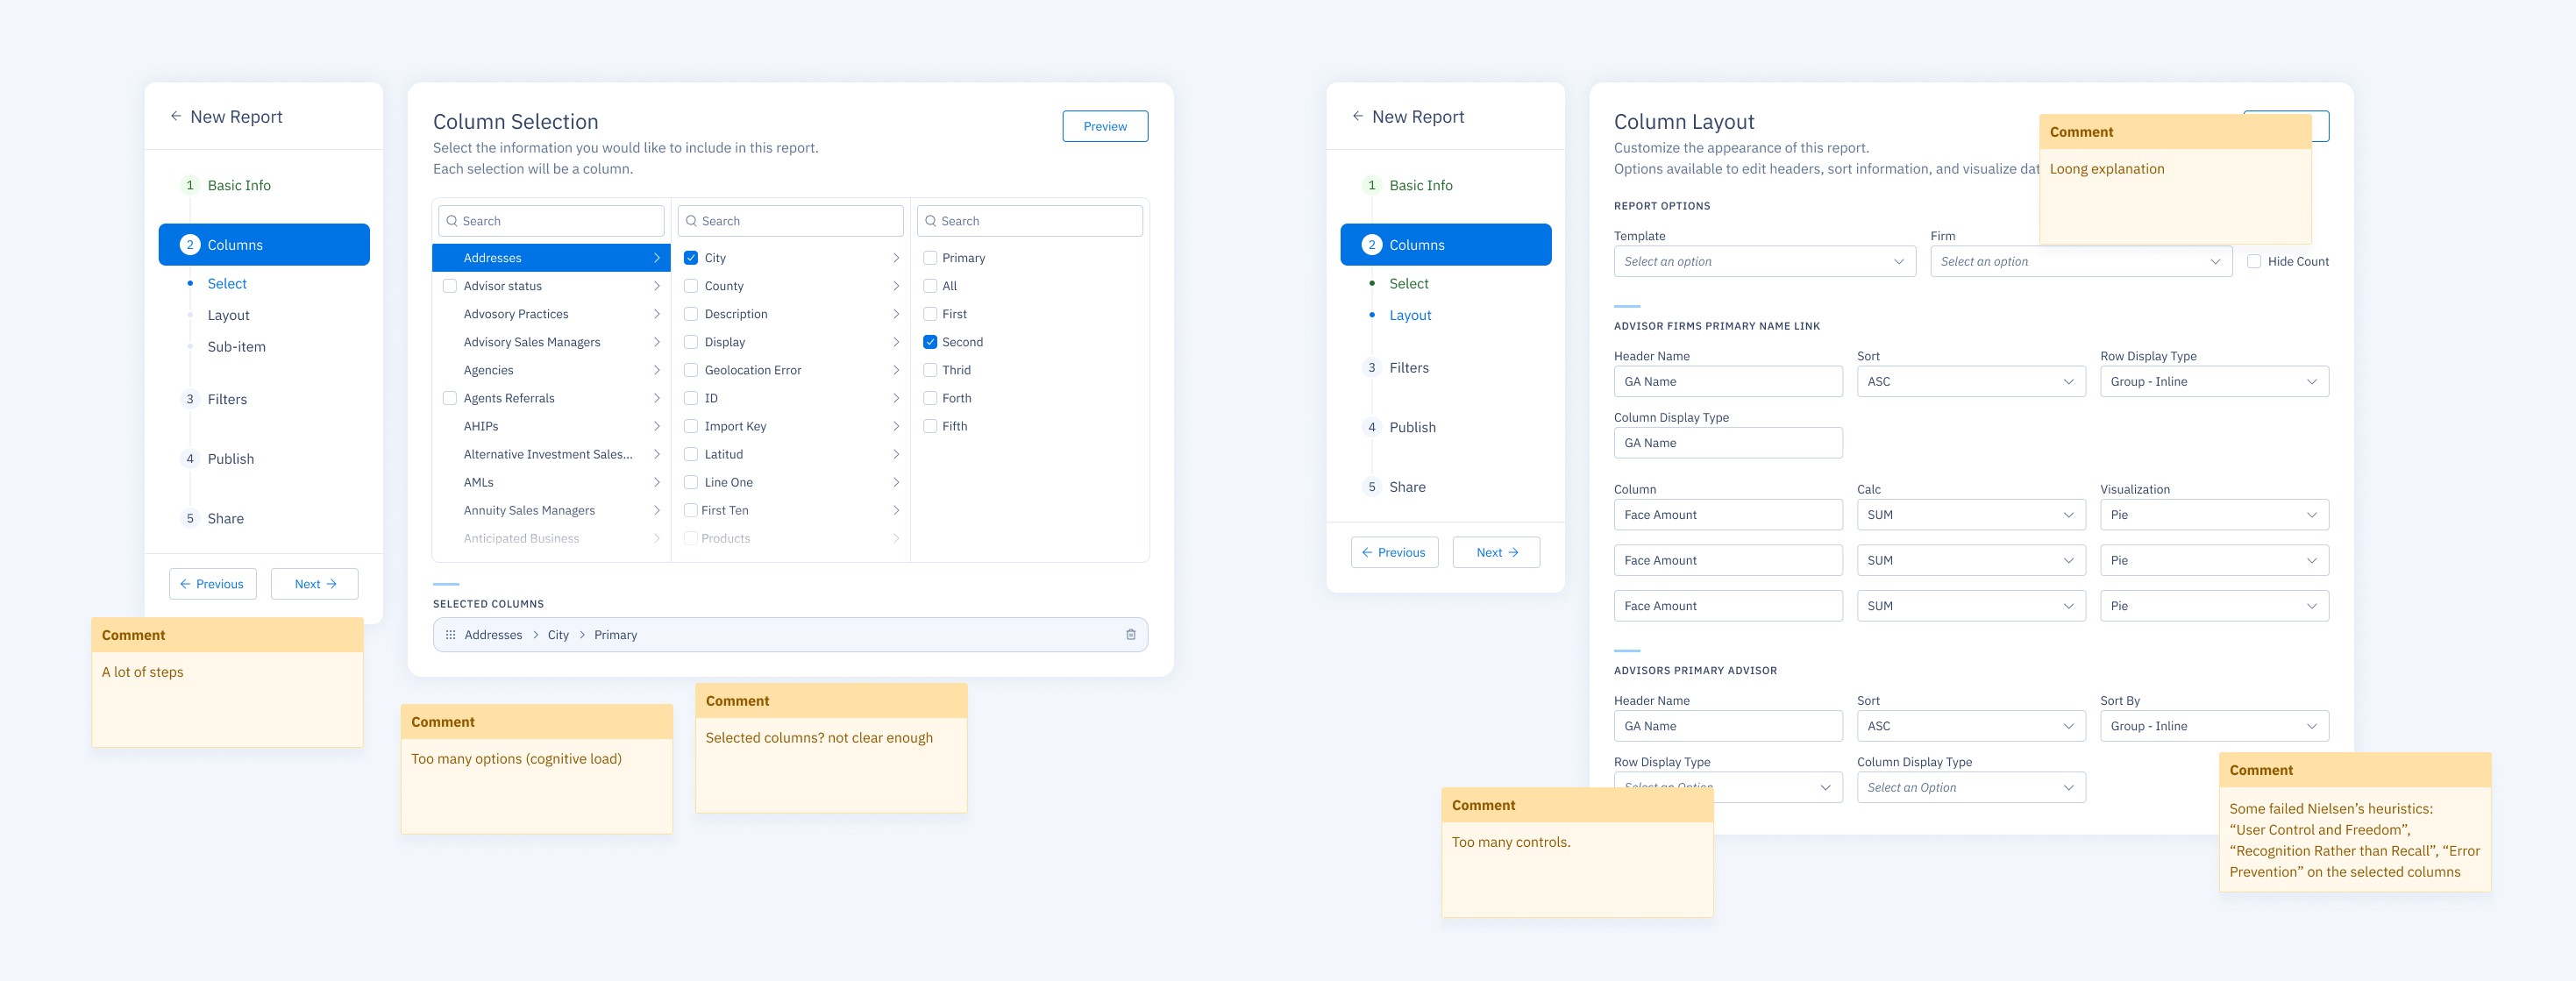
Before: settings scattered in separate forms, effect unclear until export.
After: quick, visible edits on cards with immediate feedback.
Process
Field observation and ticket mining to capture pain points.
Click-through tests validated canvas over forms and clarified versioning.
Progressive rollout with no navigation changes.
Key Decisions
Persistent canvas for speed and orientation.
Data-layer lock for naming to avoid compliance drift.
Separate schedule step for clarity and fewer mis-sends.
Accessibility and Quality
Keyboard path from canvas to preview to send.
Clear focus states and roles on all controls.
Plain-language errors with a next step.
Minimum contrast 4.5:1 on critical CTAs.
Impact
Time to assemble a monthly report.
Label mismatch rate per report.
Template reuse rate.
Share mode mix and schedule adoption.
What’s Next
Multi-tenant templates with guardrails.
Cross-report components like shared filters and KPIs.
Side-by-side diff between versions and light comments on blocks.
My Contribution
Defined success criteria and constraints with PM and engineering.
Mapped report anatomy and designed the block system.
Designed Publishing History and Send Report flows.
Wrote plain-language microcopy and guardrails.
Partnered on incremental rollout and instrumentation.
Impact / What to Measure
Time to assemble a monthly report.
Label mismatch rate per report.
Template reuse rate.
Share mode mix and schedule adoption.
What’s Next
Multi-tenant templates with guardrails.
Cross-report components like shared filters and KPIs.
Side-by-side diff between versions and light comments on blocks.
My Contribution
Defined success criteria and constraints with PM and engineering.
Mapped report anatomy and designed the block system.
Designed Publishing History and Send Report flows.
Wrote microcopy and guardrails in plain language.
Partnered on incremental rollout and instrumentation.
TL;DR
Compose, version, and send multi-page reports without leaving OneHQ.
Freeze numbers to an as-of date and keep a clear version history.
Schedule delivery as PDF or secure link with consistent branding.
The Problem
Monthly and quarterly updates relied on exports and copy-paste into slides.
Naming drift from carrier labels caused mismatches and rework.
Form-like layout made the final output hard to predict.
Teams lost track of which version was sent and when.
Goals
One place to compose, preview, and send.
Versioning with visible as-of date.
Faster assembly with fewer errors.
Reusable templates and smart defaults.
Solution at a Glance
1) Canvas with Sections and Blocks
The canvas mirrors the final report. Add sections (Overview, Premiums, Claims, Renewals, Notes) and drop blocks (charts, tables, KPIs, text, dividers).
Design notes: left sidebar for structure, right panel for block settings, sensible defaults.
2) As-of Date and Versioning
Freeze numbers to a specific date. Each freeze creates a version you can preview and reuse.
Design notes: as-of shown in header and footer, simple revert.
3) Publishing History
A thumbnail timeline lists every version with date and sender. Open any version to see exactly what went out.
Design notes: compact previews, clear sender identity, guardrail before resending older versions.
4) Scheduling controls
Immediate, specific date, or repeat every N weeks on selected weekdays at a set time. Works across time zones, respects permissions, and uses expiring links by default.
Design notes: weekday chips for quick selection, natural-language summary of the schedule, preview of the next send time, guardrails for past dates, one-click pause, clear Done state.
5) Output settings (visualization cards)
Make charts editable in-place: change type, size, color scheme, and grouping without leaving context. Add or remove visualizations with one click.
Design notes: live preview in each card, friendly dropdowns for Type, Size, and Color Scheme, accessible palettes, guardrails for invalid combinations, Hide Table to reduce noise, Add Visualization anchored in the header, keyboard and screen reader labels on all controls.
Before: settings scattered in separate forms, effect unclear until export.
After: quick, visible edits on cards with immediate feedback.
Process
Field observation and ticket mining to capture pain points.
Click-through tests validated canvas over forms and clarified versioning.
Progressive rollout with no navigation changes.
Key Decisions
Persistent canvas for speed and orientation.
Data-layer lock for naming to avoid compliance drift.
Separate schedule step for clarity and fewer mis-sends.
Accessibility and Quality
Keyboard path from canvas to preview to send.
Clear focus states and roles on all controls.
Plain-language errors with a next step.
Minimum contrast 4.5:1 on critical CTAs.
Impact
Time to assemble a monthly report.
Label mismatch rate per report.
Template reuse rate.
Share mode mix and schedule adoption.
What’s Next
Multi-tenant templates with guardrails.
Cross-report components like shared filters and KPIs.
Side-by-side diff between versions and light comments on blocks.
My Contribution
Defined success criteria and constraints with PM and engineering.
Mapped report anatomy and designed the block system.
Designed Publishing History and Send Report flows.
Wrote plain-language microcopy and guardrails.
Partnered on incremental rollout and instrumentation.
Impact / What to Measure
Time to assemble a monthly report.
Label mismatch rate per report.
Template reuse rate.
Share mode mix and schedule adoption.
What’s Next
Multi-tenant templates with guardrails.
Cross-report components like shared filters and KPIs.
Side-by-side diff between versions and light comments on blocks.
My Contribution
Defined success criteria and constraints with PM and engineering.
Mapped report anatomy and designed the block system.
Designed Publishing History and Send Report flows.
Wrote microcopy and guardrails in plain language.
Partnered on incremental rollout and instrumentation.